It’s hard to overstate the importance Rackspace played in San Antonio’s imagination about itself in the year 2009, when I first arrived in town. A scrappy mid-sized technology company, launched by 3 college kids in their proverbial dorm room, had established an early-mover advantage in the growing technology service known as cloud hosting, and was using that advantage to fend off the biggest names in tech: Amazon, Microsoft, and Google. With the cult slogan “Fanatical Support,” hopefuls wondered if Rackspace could do for San Antonio what Dell had done for Austin. Would rackers overmatch the difficult competition and transform sleepy Alamo city into a tech hub?
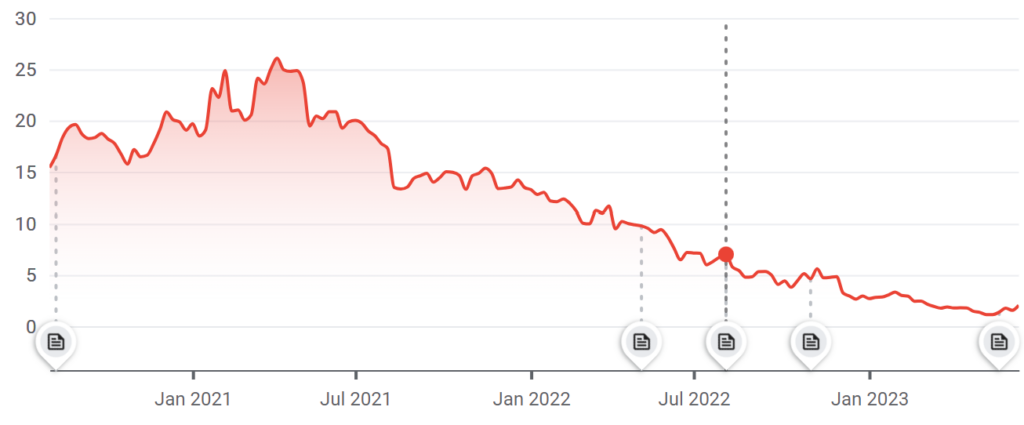
The relentless, one-way drop in RXT shares from $20 two years ago to just over $2 shares as of this writing tells us that David did not, in fact, slay Goliath. The stock’s chart over the last two years is just a Matterhorn-shaped downward slope with no bottom in sight.
The equity market capitalization dropped in that period from $4 billion to around $250 million by mid-May 2023, approaching one-twentieth of its former size. Looking at that kind of chart in May I naturally ask the fundamental question: “Is Rackspace dead?” And also the technical question, “what the heck is wrong with RXT shares?”
Now, here I want to distinguish between a company and its shares. A good company can be a bad stock investment. And in certain instances a bad company can be a good stock investment. And everything in between. I will mostly save the judgment about whether Rackspace is a good company with good long-term prospects, “the fundamentals,” for a future column. Today I mostly want to discuss “the technicals,” which addresses the question “What the heck is wrong with the stock?” rather than the more profound question of business prospects.
Still, we’ll do 3 sentences on the fundamentals, and then the rest of the column on the specific technical issues that may have plagued RXT, the stock, for the past two years, and in particular the last few months. And then a technical change in stock market plumbing announced last month that reflects RXT’s changed prospects.
The Fundamentals
RXT reported a loss of $612 million for the quarter ending March 2023, following a full year loss in 2022 of $805 million, on $759 million in quarterly and $3.1 billion in annual revenue, respectively.
As of March 2023, the company reports $3.3 billion in long-term debt at an average of 5.5 percent, not due until 2028, giving it attractively-priced debt service, and a runway of 5 years before it needs to refinance the debt.
Cloud computing services, as an industry, are projected to grow between 15 and 20 percent annually for the next 5 years, so an experienced provider that merely maintains market share with the natural tailwinds of the industry could be positioned to grow nicely.
Fundamentally, we have 5 years to find out whether Rackspace is dead.
The Technicals
So then what technical forces are crushing RXT, the stock, these past 2 years?
Technical analysis seeks to explain the current and future price movements of a stock according to the supply and demand dynamics specific to the stock. This is distinct from studying the fundamental revenue, cost, debt, and cash flows of the business itself, as we did above.
The largest holder of RXT remains private equity firm Apollo Global Management with 61 percent of the company’s shares. In 2016 Apollo took the company RAX private from the New York Stock exchange. Apollo then relaunched Rackspace via IPO under the ticker RXT in August 2020 on the tech-oriented Nasdaq. In part because Apollo still owns most shares, the supply of tradable shares, or “float,” is quite small. Very few individual, or “retail” investors own any shares.
The volume of share transactions in RXT has declined over the past year, along with the stock price. A year ago between $5 and $8 million worth of shares traded hands per day. That has slowed to an average of less than $2 million per day over the past two months.
A low “float” of the shares, the declining dollar amount of trading, and a price approaching $1 per share all tend to further depress interest in a stock among professional investors.
Non-Apollo shares are mostly owned by Small Capitalization Index Mutual funds. My strong belief is that this particular fact is the absolute key to understanding the one-way price movement of RXT over the past months.
The top mutual fund holders of RXT are all ETFs and index funds, from Vanguard, iShares Russell, and Fidelity. RXT shares are also held in some “technology,” and “total market” index funds.
A major technical problem for RXT of this ownership is that each of these indexes is “market-weighted.” This means that as the market capitalization of the company drops, the automatic weighting of the company within that index drops. That makes the indexes forced sellers of the company’s shares as prices decline, in a self-reinforcing vicious cycle.
In theory, and as often happens with other stocks, institutional value investors (non-index investor) sometimes jump in to purchase shares in this scenario, which helps to break the vicious cycle. But for most value investors RXT’s float is too small, the trading volume is too small, and most importantly, value investors don’t love annual losses larger than the market capitalization of the company. So far they’ve stayed away.
But I suspect the biggest problem with RXT is the specifics of the Russell 2000 index that happened last month, which determines ownership of small capitalization index funds.
The Russell 2000 index is comprised of US small-capitalization companies, in particular those ranked numbers 1,000 through 3,000 on the list of US companies, by size.
As of 2022, the literally smallest Russell 2000 index company – the 3,000th ranked company on the list – had a total market cap of $240.1 million. Interestingly, RXT breached that bottom floor of market capitalization last month.
The Russell 2000 index makers set April 28th 2023 as the annual cut-off date for determining who is in or out of the index. On that date, RXT had an approximate market capitalization of $320 million. This put RXT on the bubble of being dropped by the Russell 2000 index. The result of that would be further forced selling by the index holders.
New IPOs allow companies to be added quarterly. Other additions or subtractions due to growth, merger, or shrinkage happen just once a year. Companies are subtracted from the Russell 2000 index on an annual basis, and May 19th was the announcement date for whether RXT would remain in the index.
Let me not hold you in further suspense. Despite being on the bubble, RXT did not get dropped from the Russell 2000. The size of the smallest company to remain on the Russell 2000 list dropped to $159.5 million in 2023, 33 percent below the previous floor. RXT was saved in a sense because the standards for inclusion got easier!
RXT actually got added to the Russell Microcap Index for the first time on May 19 2023, the index for even smaller companies with a market capitalization going all the way down to $30 million.
But even though they were not removed from the Russell 2000 list this year, the risk of subtraction from the index, plus the vicious cycle of lower prices leading to lower market weighting, could explain much of the past few months’ price action in RXT.
Getting put on the Russell Microcap Index is somewhat analogous to relegation to a single-A baseball league down from the triple-A league where it had previously played. The stock may take a long time to ever attract major league investors. Or it may never again attract them.
Languishing in obscurity is ok for profitable companies that can put together a good fundamental track record of profit over time. It could get back on the list and in that sense be eligible again for the majors. For a company with $3 billion in debt due in 5 years, and a string of annual losses, it may be a harder slog. Time will tell.
A version of this ran in the San Antonio Express News and the Houston Chronicle
Post read (261) times.


