The Weird Outlier that is Japan, Inc

Japan is a weird financial outlier, and the last month or two has been a reminder of just how especially weird it is.

Stock Market returns

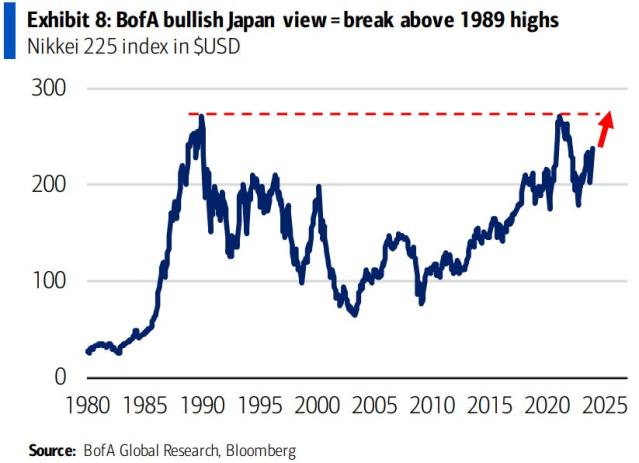
In nominal terms, an investor in the Japanese Nikkei 225 index has needed 35 years to get back to break-even, which finally happened in 2024. That’s a really long time.

December 1989 marked the absolute peak of the Nikkei 225 index, when it traded above the 38,000 level for the month. It took until early 2024 (just this year!) for the Nikkei 225 to return to trade above 38,000 again. During this 35-year round trip, the index averaged in the 15,000 range but also traded below 9,000 in 2002 to 2003, and again below 9,000 between 2008 and 2012. 

Nikkei_1989_to_2024
A 35 year round trip for the Nikkei investor

For comparison purposes, a benchmark US index, the Dow Jones Industrial Average, in December 1989 was around 2,700, compared to its level above 38,000 today. Imagine having a choice to purchase Japanese equities in 1989 versus US equities in 1989, and imagine choosing the wrong one.

One lesson I’ve always taken from the market cycle of the Japanese index is that you do not necessarily want to have all of your stock market exposure in one country, however solid and powerful it looks at the time. If you were a Japanese retiree in 1990 hoping to live off your stock market holdings by investing in your own country’s main index, that would have been a catastrophic choice. And yet, US retirees for the most part have between 80 and 100 percent of their equity holdings in US stocks. 

Currency 

We are also on a roughly 35 year cycle for the Japanese currency, then yen.

On the last day of April 2024, the Japanese yen seemed to flirt with free-fall, weakening dramatically. As of this writing the yen to dollar ratio – hovering around 150 yen to the dollar – is the weakest level that it has been since 1990.

The number of yen needed to buy $1 has only briefly and rarely stayed above 150 – meaning the currency hasn’t ever been consistently this weak – since 1986. 

One obvious implication of a weaker yen is that Japanese exports become more attractively priced for foreign consumers. Hondas, Toyotas, Sony products, semiconductors, and everything Japan produces at a world-class level becomes cheaper for us and other non-Japanese buy.

Japanese_Yen_since_1986
37 year round trip for the Yen

For market-insiders, the dramatic yen/dollar moves take place in a very specific context. One of the biggest and most “classic” hedge fund trades – going on and off for about 30 years now – is to borrow yen at low interest rates and invest the proceeds into higher interest rates available in other countries. As rates went up in the US over the past 1.5 years, this trade has become increasingly tempting. The weakening of the yen in late April is believed to be related in part to this classic trade. And the Bank of Japan is believed to have intervened April 30th to prevent the yen from weakening too much too fast.

Japanese semi-conductor companies

Another observation about the simultaneous strengthening of the Japanese real economy and weakening of the yen is the unlinking of currency strength and economic strength. As Americans we have the impression that a strong dollar implies a strong US economy.  The Japanese example shows that the correlations and direction of causation can be different.

Inflation

As part of its bid to be the finance-equivalent of bizarro-world, Japan has also been trying to kickstart a little bit of inflation in the economy, for a really long time now. Weird, right? In March the nation’s largest union negotiated a 5.28 percent wage increase, the largest in 30 years, and it was welcomed by government and businesses as a sign of economic strength rather than a dangerous sign, as it would likely have been interpreted in the US. 

ESG improvements – Japan-style

ESG has developed a somewhat bad reputation of late in investments, but we would be foolish to ignore the G of ESG – Governance. Japan long suffered from corporate practices which we in the US would consider sub-optimal governance. They allowed the survival of “zombie-banks” long after their 1989 bubble burst. Companies on the Japanese stock market long traded below book value because companies hoarded cash, did not pay dividends, maintained themselves in cozy but inefficient conglomerates, and had few outside independent directors. Japanese banks and insurance companies used to own something like 31 percent of public shares and now own 6 percent. Foreign ownership of shares has climbed from 4 percent to 30 percent. Boards of corporations were considered notoriously insider-focused and insufficiently shareholder-focused. Now in 2024 it is a lot less cozy.

Japan_map
An outlier in so many ways

The head of the Nikkei stock exchange in 2023 basically told member companies of undervalued stocks that they had to make plans for becoming more shareholder friendly – such as do share buybacks, pay dividends, and divest non-core businesses. Companies that fail to make governance improvements for the benefit of shareholders now get named and shamed by the head of their main stock exchange. The G in ESG improvement is apparently working in Japan.

Anyway, why should you care, as an American investor, about this 2024 Japanese revitalization, the end of a 35-year cycle? 

I can think of a few reasons. First, they are our most powerful ally in Asia, so it’s good they are getting financially and economically stronger. 

Second, the extremes of market moves, currency moves, and inflation moves remind us of how little we should take for granted when it comes to the limits of our macroeconomic knowledge. Japan is regularly the bizarro-world outlier that humbles us.

Third, Japan is a cautionary tale about having all of your geographic equity exposure in just one country, just one currency, or just one narrow sector. So, diversify! If you are all in US stocks, maybe you need some other countries in your portfolio? 

Maybe including, gulp, Japan?

A version of this post in the San Antonio Express News and Houston Chronicle

Post read (55) times.

Ask An Ex-Banker: Debt, Inflation, Federal Reserve

Q.  Michael, I am trying to understand something here. The government spent a ton of money that it didn’t have stimulating the economy post Covid. This caused inflation to increase. So the Fed boosts its rate to cool inflation. When the Fed boosts its rate, banks have to pay to borrow money from the government. Does that higher rate go back to the government? It’s sort of like a tax on those who don’t have money to pay for houses and cars. So the poorer portion of our society is being taxed to pay for government spending. Those who have funds to pay cash aren’t really affected by the higher rates. Is this logic correct? Thanks, I always read your column.

Alexander McLeod, San Antonio TX

A. My short answer to your final question of “is this logic correct?” is mostly “no.”

But I like your question because it combines the top three drivers of economic news in the past two years – federal debt, inflation, and the Federal Reserve – and asks for logical cause and effect linkages between them, and real-world implications. Understanding how they interact is important. I’ll do my best to break them down, using your question as prompts.

Federal_debt_2024
Federal Debt Reaches $34.5 Trillion in April 2024

Yes, the government did spend money it didn’t have. That is an ordinary thing for the US and most other governments in the world over the past century. Or basically forever. The magnitude of US borrowing has gotten substantially larger in the past decade. We do not have an actual answer yet for “how much is too much debt?” but the activity itself is highly precedented. Am I worried? Yes. But we don’t have certainty on whether we’ve hit limits or what the limits are.

“This caused inflation to increase” is not the right cause-and-effect. More accurately, the combination of low interest rates, extra fiscal (COVID) stimulus, and an energy shock from the Russian invasion of Ukraine probably caused inflation to spike dramatically in the summer of 2022. The rate of inflation has since dropped to a normal range, even if prices (outside of energy) have not declined. Prices rarely outright decline. 

The Fed did boost rates beginning in 2022 to cool inflation, as a 2 percent inflation rate is one of its key goals and mandates. Inflation is around 3.5 percent as of this writing, and the Fed as a result has indicated recently that it may not lower rates until further progress is made on inflation.

Fed_Fund_Rate_2021_to_2024
Fed Fund Effective Rate 2001 to February 2024

Higher benchmark interest rates are set by the Federal Reserve, technically both the country’s central bank and also technically a non-governmental entity. The interest paid and the interest earned by the Federal Reserve requires an extra step of explanation for accuracy. 

As the central bank for the US, the Federal Reserve actually pays interest to banks for their excess reserves. The Federal Reserve also uses funds to go out in the marketplace to buy US government bonds, and earns interest on the rate that the US government pays on its bonds.

“Who is making extra money off of higher interest rates?” is part of your question, and viewed a certain way, the Federal Reserve actually books extra interest income based on the difference between what it pays banks for deposits and what it earns on securities with its balance sheet. 

Private banks, which raise interest rates on consumers and businesses when the Federal Reserve raises interest rates on them, may earn higher interest income in this environment than they did before. But private banks are not the government. 

The federal government, by contrast, earns no big amounts of money from higher interest rates. 

Not at all. Basically, just the opposite. The US government, as a massive borrower, pays more in terms of higher interest rates.

The Federal Reserve may earn money as a net lender if it chooses to own more bonds, especially following times of monetary stress like 2008 and 2020. Private banks may earn more as lenders in a higher interest rate environment. The federal government, however, pays a lot more. 

To your question of whether higher rates are like a tax on people who do not have money to own cars or houses by paying cash for them, I would say “sort of,” but that it’s not very specific to our current higher interest rates environment. What I mean by that is that in every interest rate environment, low or high, individuals who borrow month to month on their credit card are paying in the 12 to 25 percent interest range. That’s the real and substantial tax on people who borrow, but it happens all the time, not just now. And the “tax” goes to banks and credit card lenders, not the government.

Wealthier folks, or people with substantial savings in the bank, are in a position – right now – to earn more on their savings than they have over the previous 2 decades, roughly 2001 to 2022. That’s again neither a tax nor a government bonus, but a private sector cost or benefit of participating in the banking system and earning interest on one’s savings. 

Your statement “the poorer section of our society is being taxed to pay for government spending” is an inaccurate understanding. To vastly simplify things, I would generalize the situation the following way instead:

Folks with no savings (generally poorer, but this can include middle- and upper-income people as well) are generally paying high interest rates to credit card lenders in every interest rate environment. At all time.

Folks with middle and upper incomes who borrow to own a car or home are paying higher interest rates, right now, to private lenders on their car and home loans. But again that extra income is captured largely by private lenders, not the government. 

Wealthier folks and institutions with surplus funds are earning higher interest rates on their savings and interest-bearing investments. If they lend to the US government by buying government bonds, they are earning a lot more now than they did two years ago.

The federal government is a pauper in this scenario, and is paying out higher interest rates. Not exactly like on a credit card, because the rates are roughly 4.5 to 5.5 percent. But that’s much worse than the 1.5 to 2.5 percent it was able to pay a few years ago. The Federal Reserve pays higher rates of interest for private bank deposits, but also earns higher rates on the bonds it buys. Although it has higher earnings in recent years, that has more to do with its larger post-crisis balance sheet than anything else. 

Federal_Reserve_Balance_Sheet_April_2024
Federal Reserve balance sheet 2008 to April 2024

As for “those who pay cash aren’t really affected by higher rates,” I’d say that’s somewhat true. But more than that: those who have cash are benefitted by higher rates, since they can earn more money on their savings. 

A version of this ran in the San Antonio Express News and Houston Chronicle.

Post read (92) times.

DJT Is Just Perfect

Have you ever seen a more perfect match up between public company Trump Media & Technology Group Corp – aka DJT the stock – and the public persona of Donald J. Trump, the man and leader? It’s beautiful.

DJT post merger through April 2024

It’s huge, and some people still don’t get it. The people who don’t get it should be fired. I would just say that to them: You’re fired! 

Or rounded up and deported. Or worse. It could be a bloodbath. Financially, I mean. Or I don’t know, maybe some other way? 

The fake media will try to focus your attention on the “fundamentals” of DJT the stock: $4 million in revenue in 2023, on a $58 million net loss for the year, followed by a $8 billion value when the merger was completed. Later, the company bounced in value between a $4 and $5 billion market capitalization. 

Did the stock drop in April because it was trading at a valuation of 2,000 times its annual revenue? No, you should not try to apply the low energy rules of traditional finance to DJT. 

DJT is a perfect meme stock

To try to describe DJT from a fundamental perspective is to live in the old boring world.

Meme stock investing – which is what drives interest in DJT the stock – is about the grassroots. It’s about real, American people who don’t need experience with the stock market to stick it to the man.

Yeah sure, DJT the stock is volatile. Over the course of a week in mid-April it’s gone up or down by at least 15 percent a day, multiple times. That’s what keeps people talking about it, like its namesake. People can’t get enough of Trump, it’s exciting.

The Wall Street elites can talk about fundamentals until they are bleeding out of their eyeballs or their wherevers. 

unhappy_trump

As a meme stock, the point in buying DJT is not to turn a profit. The point is to band together in a show of solidarity against the enemies of Trump, who are also incidentally the enemies of grassroots real Americans. What matters is faith. If everyone works together and buys DJT, it can’t go down. It’s as simple as that.

When everybody is against him, that’s the point of maximum power for Trump. Because if the stock begins to rise, the elites have to cover their shorts, and they can lose, literally, an unlimited amount of money. That’s how it works with heavily-shorted stocks. When all the hedge funds and big boys are short, that is when grassroots real Americans show their faith in Greatness, and Trump. We saw that with meme stocks like AMC and Gamestop in 2021. We’ll see it again with DJT. Can you imagine if it comes out that Nancy Pelosi and George Soros have shorted DJT? I’m not saying they did. I’m just saying that would be a sweet day of reckoning.

Trump-Miss-Universe-Moscow
Trump in 2013 with Aras Aragalov, Putin-linked billionaire, for Miss Universe Moscow

Next they’ll say the Russians are buying DJT. The Russians, the Russians! Always the Russians. They probably are, who cares? That’s a big beautiful country too. Beautiful women. Christians, I’m told. Trump even hosted a Miss Universe pageant there in 2013 and met all the important leaders then.

DJT built on fraud?

Like its namesake, DJT the stock has been in a series of byzantine legal tangles. 

When DJT’s predecessor company was just a blank-check company called Digital World Acquisition Corp prior to the merger with Truth Social, the company and people around it allegedly broke some laws. 

In July 2023 the SEC settled accusations that insiders had fraudulently purchased DWAC shares with knowledge of a merger with Trump’s Truth Social business for $18 million. 

Three other investors were accused in June 2023 of making $22 million of illegal profit from insider trading on advance knowledge of the merger. That’s a lot more illegal profit than the company had revenue in 2023.

If supporters of the Law and Order party regularly dismiss accusations, arrests, settlements, and convictions for fraud, does that mean we should doubt the sincerity of either DJT the stock or Donald Trump the leader? No. It just means that we need to root out the deep state swamp things in the SEC and FBI who have a not-so-hidden agenda. Law enforcement officers will do anything to try to attack Trump, which is very unfair.

Under the next Trump presidency, those very nasty prosecutors at the SEC and FBI will hopefully be taken care of, so we can get back to backing the blue and having Law and Order again.

The stock swoons in mid-April as more shares will trade soon

Now, as is only correct, Trump the man currently owns nearly 60 percent of DJT the stock. This briefly gave him in March 2023 a 4.8 billion net-worth bump, on paper. 

As of this writing, the stock is sharply down to $5 billion from an approximately $8 billion valuation, after it merged with Truth Social. 

[****Ric – we can check this market cap mid-week before publishing? It’s been super-duper volatile.]

Company filings on April 15 described a large supply of additional DJT shares that may soon become available to trade. 

As of now, less than 29 million shares of DJT freely trade in the marketplace. 

By September 2024 there will be roughly 200 million tradable shares of DJT. Trump the man owns 79 million total, with rights to acquire another 36 million. Other insiders own 30 million with rights to acquire another 4 million shares. 

Under ordinary rules for a company going public, Trump and the other insiders cannot sell any of their stakes in the company until September, after a 6-month lockup. Should those rules apply to Trump? Is it fair to apply rules in an extremely unfair-to-Trump world? You tell me. Maybe the board of directors can look into this.

Does this have all the makings of a classic pump and dump stock fraud? What makes you think that?

A recent filing by DJT the company notes that “Because President Donald J Trump is a candidate for President, he may, subject to the Lock-Up Period, divest his interest in Truth Social.” I have long admired his willingness to divest his business interests to avoid any possible conflict of interest, so it just makes sense that he may need to abruptly sell his company shares in September 2024 due to his imminent election to the Presidency. 

Did the stock drop in April because of the expectation that Trump will sell his shares, cleverly taking advantage of the blind faith of his supporters and leaving them holding an empty bag? Why would you say that?

Trump’s ability to shift losses onto others while preserving his own financial viability is interpreted by his supporters as entrepreneurial cleverness rather than recognized as venal.

This assumption of cleverness rather than venality covers a lot of Trump history, such as the bankruptcy of Trump Taj Mahal in 1991, Trump Plaza in 1992, Trump Hotel and Casino Resorts in 2004, and Trump Entertainment Resorts in 2009. Plus, the failure of various brands – steaks, wine – and the fraud settlement for Trump University.

What part about Trump’s long history of bankruptcies, plus refusing to pay workers and creditors, makes you think he would abruptly offload his stock on his most loyal supporters now? I just can’t believe he would do that to them. Literally in September 2024. Or sooner, if the company’s directors allow him.

If the end result of sticking it to the man by disregarding any rules about earnings or profits or an authentic business is that regular real grassroots Americans are eagerly fleeced, and the self-marketing genius who inherited his real estate fortune from Daddy gets his net worth inflated by a few billion dollars in the process, well that’s just further evidence of his cleverness, no?

This DJT meme stock is just perfect.

A version of this post ran in the San Antonio Express News and Houston Chronicle

Please see related posts

Trump – A Threat To Democracy I

Trump – A Threat to Democracy II

Post read (144) times.

Ask an Ex-Banker – Fama and French

Dear Michael,

My interest, as a long-term investor, is in what you have to say about small cap value vs growth funds and value vs growth investments in general. Don’t get me started on emerging markets and international funds – I’ve watched them for many years, and just don’t get the point.  I believe in sticking close to home, especially with many larger US companies already involved in foreign countries’ economies. Anyways, keep the individual investor articles coming; they’re my favorite.  

Dave M., San Antonio, TX

Dear Dave,

Thanks for your questions and comments, which give me a chance to get nerdy on asset allocation, finance theory, and investing practice. 

First, some definitions. Value usually means “cheap” on some investment metric. You would expect to earn money through the steady continuity or recovery of the business. These often pay dividends which make up the majority of long-term returns. 

By contrast, growth usually means the company isn’t done innovating within its industry, but may not pay substantial dividends as it strives for growth. Growth companies offer price appreciation as the driver of long-term returns. Value is more “fundamental” investing and growth is more “story” investing. Both are valid. 

Small cap these days usually means public companies worth up to $2 billion or a little larger. Large cap usually means $10 billion or more, but ranges all the way up to trillion dollar+ companies. Mid cap means, you guessed it, in between $2 and $10 billion.

As an adherent to the efficient markets hypothesis, my initial answer to your question is that both growth and value are fine, all capitalization ranges are fine, and further that probably none is permanently better than the other. For multiple years in a row you could expect one style or capitalization range to outshine the other, only for that outperformance to be reversed in a subsequent decade.

Beginning In the 1970s and continuing through the 2000s, finance theorists Eugene Fama and Kenneth French studied whether certain sectors consistently outperformed others. The short answer to their decades of research: Value stocks and small cap stocks seemed to offer higher returns in their analysis, based on data going back to 1928. 

“Value” and “Small” are maybe best?

There are some intuitive reasons to think small cap and value investing might have advantages over other parts of the stock market.

Small companies’ shares may be inherently more volatile. Since investors often don’t like volatility, it makes sense that less investor capital would be allocated to volatile assets. That relative scarcity of capital would then raise returns for those brave souls who don’t mind volatility as much. In finance terms, efficient markets should still allow for a greater absolute return to higher volatility assets, as a compensation for the volatility. This could explain a persistent higher return for small caps when compared to large caps over the long run.

A similar theory could apply to value stocks versus growth stocks. Sometimes a value stock is relatively cheap because the CEO used bad words on social media or because the company sells known cancer-causing products like tobacco. Some investors don’t like bad words or cancer, so they don’t invest in those companies. That leaves a potential higher return for less squeamish investors. Like small cap investing, aversion by some investors might lead to persistent outperformance of value stocks for investors with less aversion. 

So now you know which categories might outperform over the long run according to respectable finance theory. But also, they might not anymore? The confounding problem that keeps finance nerds awake at night is this: What is the time horizon measured? And do we still think that what Fama and French found holds true?

Fama_and_French
A decent summation of Fama and French Capital Asset Pricing Model!

Also, if investors knew the results of Fama and French’s research (few individual investors know it, many professional investors know it, while all academics know it) wouldn’t they then favor value and small cap stocks, and the historical advantage would disappear due to investors’ interest in these sectors? The higher returns from any given sector (value versus growth, small versus large) seems, to me, logically ephemeral. Even so, I’m acknowledging ephemera may last for years or decades. 

Large caps for example have absolutely crushed small caps over the last decade, and in particular the last few years. In fact, large growth stocks – currently dubbed the “magnificent seven” by the financial infotainment industrial complex – have been the place to be for a few years now. So again, make of that what you will. 

The important thing, at the end of the day, is that if you can smoothly name-drop “Fama and French” and use the phrases “Efficient Markets Hypothesis” and “Capital Asset Pricing Model” in certain investment circles, people’s regard for you will skyrocket. “There goes a super-smart investor,” they’ll say, shaking their head with wonder in their eyes, as you saunter past. 

And as for actually investing, maybe just try to own some of each category? Good luck!

To return to your international/emerging markets investing commentary and questions, we disagree.

Lars Kroijer of Investing Demystified

As an “efficient markets hypothesis” advocate, the optimal non-US investment exposure should take into account – and roughly reflect – the weight of the US stock market versus global stock markets. Since US stocks are roughly 43 percent of global stocks, that’s the right place to begin – in theory – on how much of your investment portfolio should be in US stocks. For a fully-developed explanation of this specific idea, I highly recommend Lars Kroijer’s excellent Investing Demystified

Further supporting Kroijer’s argument is the diversification problem that US investors typically have US-only real estate and US-only incomes and US dollar-denominated assets, so a US-heavy investment portfolio kind of stacks their correlation risks. Sophisticated citizens of other countries with substantial investments would never dream of investing only in their domestic stock market, domestic real estate, in their domestic currency, with their in-country domestic incomes. They are much more likely to seek to geographically diversify their financial risk exposures. History has borne out their very good reasons for doing this. A Japanese investor who bought their domestic Nikkei index in 1990 would still not have reached break-even levels, 34 years later. You don’t want to be that kind of undiversified investor. Even if you also believe deeply in American exceptionalism, which many of us do.

Nikkei_225
It’s been a long climb back for Japanese stock market investors

Now, in practice, I’ve never met a retail US investor with such a low US stock market exposure as 43 percent. And while I’ve told you my theoretical starting point, my wife and my retirement accounts are a combined 77 percent in US stocks. You also make a fine point that large multinationals in the US will have substantial non-domestic exposure. So you get some international exposure mostly via large-cap investing, but without having to take non-US regulatory, tax, and geopolitical risks.

Still, we have emerging market and developed country index funds in our retirement accounts. Maybe the best way to remain open to the idea of international diversification is that the next world-beating company just might come out of Brazil or India or South Korea or Belgium or South Africa. The top tech companies in the world won’t come from Silicon Valley always and forever, even if they did for the last 30 years. So I believe it’s worth having some future exposure to the next “Google from Bangladesh.”

Finally, my own retirement portfolio consists of just three positions, each 100 percent equity index mutual funds, in roughly ⅓ proportions: One international fund, one small-cap fund, and one high yield dividend-value fund. So while I’m somewhat skeptical about the Fama and French theory, I totally follow their lead anyway. It’s as good a plan as any.

A version of this post ran in the San Antonio Express News and Houston Chronicle.

Please see related posts

Book Review: Investing Demystified by Lars Kroijer

Guest Post: Lars Kroijer on investing Agnosticism

Interview: Lars Kroijer Part I

Interview: Lars Kroijer Part II

Don’t Forget International Stocks

As an Ex-Banker – Mutual Fund Investing

Post read (389) times.

Investing in Texas Exceptionalism

In June 2023 I featured a real estate investor who had made the bull case for Texas that it enjoyed unusual tailwinds as a diversified economy with low costs and a business-friendly government. 

Ten years ago Hearst Newspapers columnist Erica Grieder wrote a whole book with this thesis Big, Hot, Cheap, and Right: What America Can Learn From The Strange Genius of Texas

If you agree with this perspective, you now have a way to express this bet with your own money through a single exchange-traded fund, or ETF. 

The central thesis of the new ETF (ticker TXS) launched in July 2023 by sponsor Texas Capital Bank, is that “companies headquartered in Texas enjoy certain economic, regulatory, taxation, workforce and other benefits relative to companies headquartered in other states,” according to the prospectus.

Ed Rosenberg, Managing Director for ETFs and funds management at Texas Capital Bank put it to me this way: ““The Texas economy is growing faster than the rest of the country. You have a lot of companies moving here, for obvious business reasons. It’s cheaper, and it has a better tax situation. There is a lot of young talent. A lot of people want to live in the state. Texas has more Fortune 500 companies headquartered here than any other state.”

You can imagine this kind of message appeals to state leadership. In fact Governor Abbott has been doing yeoman’s work to tout this new ETF, and even celebrated it by ringing the closing bell at the New York Stock Exchange on September 29th, along with executives from Texas Capital Bank. 

How should we evaluate this fund on its merits?

In order of priority, in evaluating a potential investment mutual fund or ETF, I would look at effective diversification within its theme, fund cost, tax-sensitivity and lastly, a track record of returns. 

Diversification

The managers of TXS have paid outside data firm Syntax to create a unique index with two layers to it. The first layer is built on data from the US Bureau of Economic Analysis, which measures the GDP of Texas to figure out which industries contribute to the economy, in what proportions.

Syntax then seeks to match the industry weightings of the fund to the relative influence of different sectors on the Texas economy. The managers identified eleven separate industries that make up the Texas economy.  Energy is the largest component, but is still less than 25 percent of the index. Meanwhile consumer discretionary, industrials, and information technology make up 14.5, 12.7, and 11.5 percent of the Texas economy respectively, and therefore make up that much of the index on which TXS is built. From there, the index qualifies companies within each sector, and weights them according to market capitalization, which just means their size. 

As of September 29th, the top ten largest holdings comprised 35 percent of the fund, including well-known Texas-based companies such as Tesla, Exxon, Charles Schwab and Waste Management. So there is some significant concentration with giant companies headquartered in Texas. 

Further criteria for inclusion: Companies have to be headquartered in Texas, and meet liquidity and publicly-traded size characteristics. No penny stocks here, or closely held companies with a tiny “float,” of shares that barely trade. Overall the ETF owns more than 200 companies in eleven separate GDP-weighted industries, so certainly passes the diversification test. 

TXS_ETF
Digging into the TXS details versus benchmark

Something that the fund by definition does not offer is geographic diversification, but rather the opposite, geographic concentration. An investor would need to achieve geographic diversification with some other vehicle.

Style

One thing we can say about TXS, relative to the mid-cap index against which it is judged, is that the Texas companies in the index overall skew more toward a “value” orientation rather than a “growth” orientation. This is reflected in the dividend yield (higher than the index), in the price/earnings ratio (lower than the index) and the fact that energy rather than technology is the largest industry within the fund. That doesn’t predict returns in the future, but it is a set of characteristics that would help an investor or investment advisor figure out how TXS could interact with other investments within a larger portfolio.

Costs

TXS charges a 0.49% management fee. Management fees for mutual funds and ETFs have come down dramatically over the past two decades. If a standard mutual fund would have cost around 1 percent in fees in 1993 or 2003, the competition from low-cost index funds has made a 1 percent mutual fund or ETF an outlier today. Many passive ETFs charge 0.03 percent or 0.1 percent these days, one-thirtieth or one-tenth of what might have been standard two decades ago. To choose a higher cost ETF in 2023 is to make the implied bet that the higher-cost fund will consistently outperform its benchmark, every year. That rarely happens, so it’s rarely worth doing. TXS at one-half of one percent is somewhat expensive for an ETF. You’d expect it to earn half of one percent higher than comparable funds every year to justify the costs.

I’d grade TXS with a solid B in terms of cost. It’s not 1 percent pricey, but there are many cheaper ETFs in the marketplace.

Tax 

Tax sensitivity matters only for funds held outside of a tax-deferred retirement account. A “tax-sensitive” fund refers to the idea that high-turnover funds may generate capital gains tax liability throughout the year that a low-turnover fund does not. In general, tax sensitivity would favor passively-managed investments over actively-managed investments, and a long-term buy-and-hold approach instead of a short-term tactical approach. 

TXS describes itself as passively managed, so should end up fine on a tax sensitivity measurement. The portfolio manager also has discretion to manage securities to minimize taxes, according to Rosenberg.

Expected Returns 

TXS first became available in July 2023, so past performance measurement in October 2023 is meaningless. I mention this mostly to make the point that short-term returns should be a pretty low priority when picking this, or any other, fund. 

A rookie mistake in purchasing ETFs and mutual funds is to choose the best performing recent fund over the past 1 or 3, or even 5 years. Not only is that time horizon too short to give meaningful information, but that approach puts the investor at risk of buying hot funds, just as the market or investment fashion takes a turn in a different direction.  

Any outperformance of the fund versus its benchmark may be attributed to the initial thesis of the fund over the longest period of time. Or, it could be attributable to other factors that will be mostly understood in retrospect. In any case, judging returns of a fund in a time period less than 10 years is to risk conflating noise and signal. 

We might have some useful data 10 years from now to judge whether the “Texas Thesis” of 2023 was a good one or not. But we definitely don’t have enough data now to make that judgment. So investing in TXS can only be based on a hunch and a gamble. I’m not knocking gambles. Lots of investing is done this way. I just think it’s useful to acknowledge that we’re doing that.

I do not personally own TXS in my portfolio, at least for now. (Your daily reminder: super-low cost, super-diversified equity index funds all the way, baby!). For similar life-philosophy and personality reasons I also don’t drive a King Ranch Ford F-150. For investors who don’t mind paying a little extra and who believe in the exceptionalism of Texas, Texas Capital Bank has invented a clever way to put your money where your cowboy boots are.

A version of this post ran in the San Antonio Express-News and Houston Chronicle.

Please see related post:

Book Review: Big Hot Cheap and Right, by Erica Grieder

Post read (122) times.

Ask An Ex-Banker: Tax Loss Harvesting

Q. We have a number of investments through Vanguard – small, mid and large cap, some real estate and bonds. All have low costs. Our advisor (from another provider) recently suggested we rebalance, moving some small and mid-cap to large-cap funds. She said we should do this via “loss harvesting.”  I have tried to read up and look at the funds online to figure what funds would be smart to sell.  But the information provided is confusing (and seems to change) and it seems somewhat complicated. Any advice on how best to proceed such as what metrics to base the decision on?

B. Dempsey, San Antonio TX

A. The goal of tax loss harvesting is, through a careful series of sales, to offset some gains you might have from selling an asset with losses you might incur in the same calendar year. Losses that offset gains can leave you with a smaller tax bill. This is especially relevant if you have highly appreciated assets, or assets that were gifted to you that were bought at a much lower price. (Having a “low basis” in investment lingo.)

That’s the theory. 

Tax loss harvesting is easiest to understand on individual stocks.  Let’s say your Google stock appreciated by $50K based on where you sold it and you owed $7,500 on the gains because of the 15% long term capital gains tax rate. And then let’s say you also sold Pepsi in the same year, and you lost $10 thousand between where you bought it and where you sold it. The $10 thousand loss on Pepsi can be netted against the $50 thousand gain on Google if the sales occur in the same year. The result: you are only taxed 15 percent on $40 thousand in capital gains, and your tax bill drops by $1,500. Which is cool. 

But frankly it isn’t probably as important a factor for your long term net worth than the decision in the first place to own, or not own, Google or Pepsi. And in what proportions, and for how long.

The biggest choice is the investment itself, not the taxes

As always when people decide to get clever about saving on taxes, my very strong instinct is to remind them that taxes are the tail, stocks are the dog. Do not let your clever tax strategy (the tail) determine your investment asset allocation (the dog).

You can do this same netting of gains and losses on short-term stock holdings as well, which usually incur a higher tax rate since short term capital gains taxes match your income tax rate. Probably something above 15 percent.

If this seems confusing so far, I think that’s a good sign you don’t want to do it on your own and you may either need to hire an advisor or deputize your existing advisor to do it for you. 

I’m usually somewhere between skeptical and opposed to introducing investment complexity and additional advisors to one’s investment life, so I’ll try to offer a bit more about the narrow set of situations you might consider this for, as well as ways to accomplish this over time.

Tax loss harvesting is something you’d only do in your taxable (non-retirement) accounts, since it’s supposed to address the potential problem of capital gains. You won’t ever pay any capital gains in your tax-deferred retirement accounts.

I think it’s also worth saying up front that the most tax-efficient strategy you can do with your taxable investment portfolio in every case is: never, ever sell. 

Under current law, assets you never sell produce no capital gains taxes at the time of your death for you or your heirs. While your advisor is suggesting you “do something” (rebalancing) and then “do another something” (tax loss harvesting) as a result, my instinct is usually to tell people to “do nothing,” especially if you want to be tax-efficient. 

If you do go ahead and reposition your portfolio anyway, it becomes relevant at the end of the year in which you might pay capital gains to think about whether other sales you can do might produce tax-offsetting losses. 

In 2023, it would not have been surprising if you had losses in your bond portfolio, for example. Individual securities that went down from the time you bought them would be other candidates for locking in losses, although I again would not advise selling something just “for the taxes.” 

As for tax loss harvesting by selling a small-cap or medium-cap mutual fund, that seems too difficult for an individual to undertake on their own. You probably need to engage with an advisor if you want to do that, and that’s going to cost you money, which will raise the issue of whether a tax loss harvesting strategy is overall worth it. (more on that below) 

Another skeptical note, from me: Does incurring taxes by selling your existing low-cost mid-cap and small-cap index funds, and then doing tax-loss harvesting after the sales, truly improve your portfolio? In most market environments indexes of different capitalization are very highly correlated, so you are getting questionable improvements while upping your tax bill and maybe upping your management fees? 

There are at least two other ways to rebalance in a more tax efficient way. One would be to direct new purchases from the bond interest payments and stock dividends into larger cap funds. It would take a longer period of time but without any capital gains taxes. Another would be to just decide any new purchases go into large caps, but without selling the existing positions. A third way is to make the reallocation through changes to your non-taxable portfolio (like within a retirement account), as that doesn’t create a tax bill. Obviously I don’t know the positions of your portfolio and I don’t know your specific financial situation. I’m just a skeptical guy asking whether this advisor is really helping, or is this advisor making suggestions that just look like they are helping?

Going slightly beyond your question, there also exists the relatively new idea in investment management of actively tax-loss harvesting your existing taxable portfolio, not for rebalancing but specifically for tax efficiency.

Brokerages offer tax-loss harvesting strategy as a service within a portfolio that can act like a mutual fund. Fidelity for example offers something that should offer the performance of the S&P500 index, but at any given time they buy and sell individual stocks in ways that minimize capital gains taxes through tax loss harvesting. Since they charge 0.2 to 0.4 percent for this service, they would need to deliver some after-tax outperformance.

Fidelity and other brokerages offer tax-managed investing. For a fee, of course.

An academic research study from 2020 suggests that a tax loss harvesting program like this could save between 0.8 and 1.08 percent per year on your portfolio.

Since tax loss harvesting adds complexity to your investment life, I think it only becomes relevant if you have a large – probably multi-million dollar – taxable portfolio. 

At that scale, paying an advisor to generate an additional estimated 0.6 per year on your taxable portfolio may make sense.

A version of this ran in the San Antonio Express News and Houston Chronicle.

Post read (126) times.